




Services

Core Engineering Pillars

View All

Solutions

28+ Enterprise Accelerators

View All

Global Desks

Global Regional Desks

View All

Industries

View All

Impact & Portfolio

Selected Engineering Case Studies

View All

Company

People, Governance & Careers

100% bilateral NDA protected. 100% IP code ownership transfer.
ABDM M1/M2/M3HIPAA / BAA ReadyGDPR CompliantSOC-2 Architecture
Case study: Energy & Utilities

SmartGridTelemetryArchitectureforHigh-VolumeEnergyData

A reference design for a high-throughput pipeline that ingests, processes and delivers meter, substation and sensor data in real time.

Telemetry pipeline Simulated stream
0M+ events per second. Illustrative target, requires validation.
SourcesEdge gatewaysIngestionStream processingStorageGrid apps
IndustryEnergy & Utilities
Solution focusSmart grid telemetry, real-time data engineering
Architecture focusEvent ingestion, stream processing, scalable data infrastructure
Performance target10M+ events per second

Illustrative reference architecture. Not a verified statement of work or a measured deployment for Tata Power.

Where telemetry pipelines break under load

As device counts and reporting frequency grow, five pressures decide whether a pipeline holds.

From meter to decision in real time

Modern smart grids generate large volumes of telemetry from smart meters, substations, grid sensors and intelligent electronic devices. Processing those events efficiently is what gives operators grid visibility, analytics, anomaly detection and data-driven energy management.

This case study outlines a reference architecture for a platform designed around a potential target of more than 10 million events per second.

  • Horizontal scalability
  • Resilient event ingestion
  • Low-latency stream processing
  • Reliable data delivery
Telemetry sources
Smart metersSubstationsGrid sensorsIntelligent electronic devicesConnected infrastructure
What it enables
Grid visibilityOperational analyticsAnomaly detectionEnergy management

Illustrative solution concept. Not a verified statement of work or a measured deployment for Tata Power.

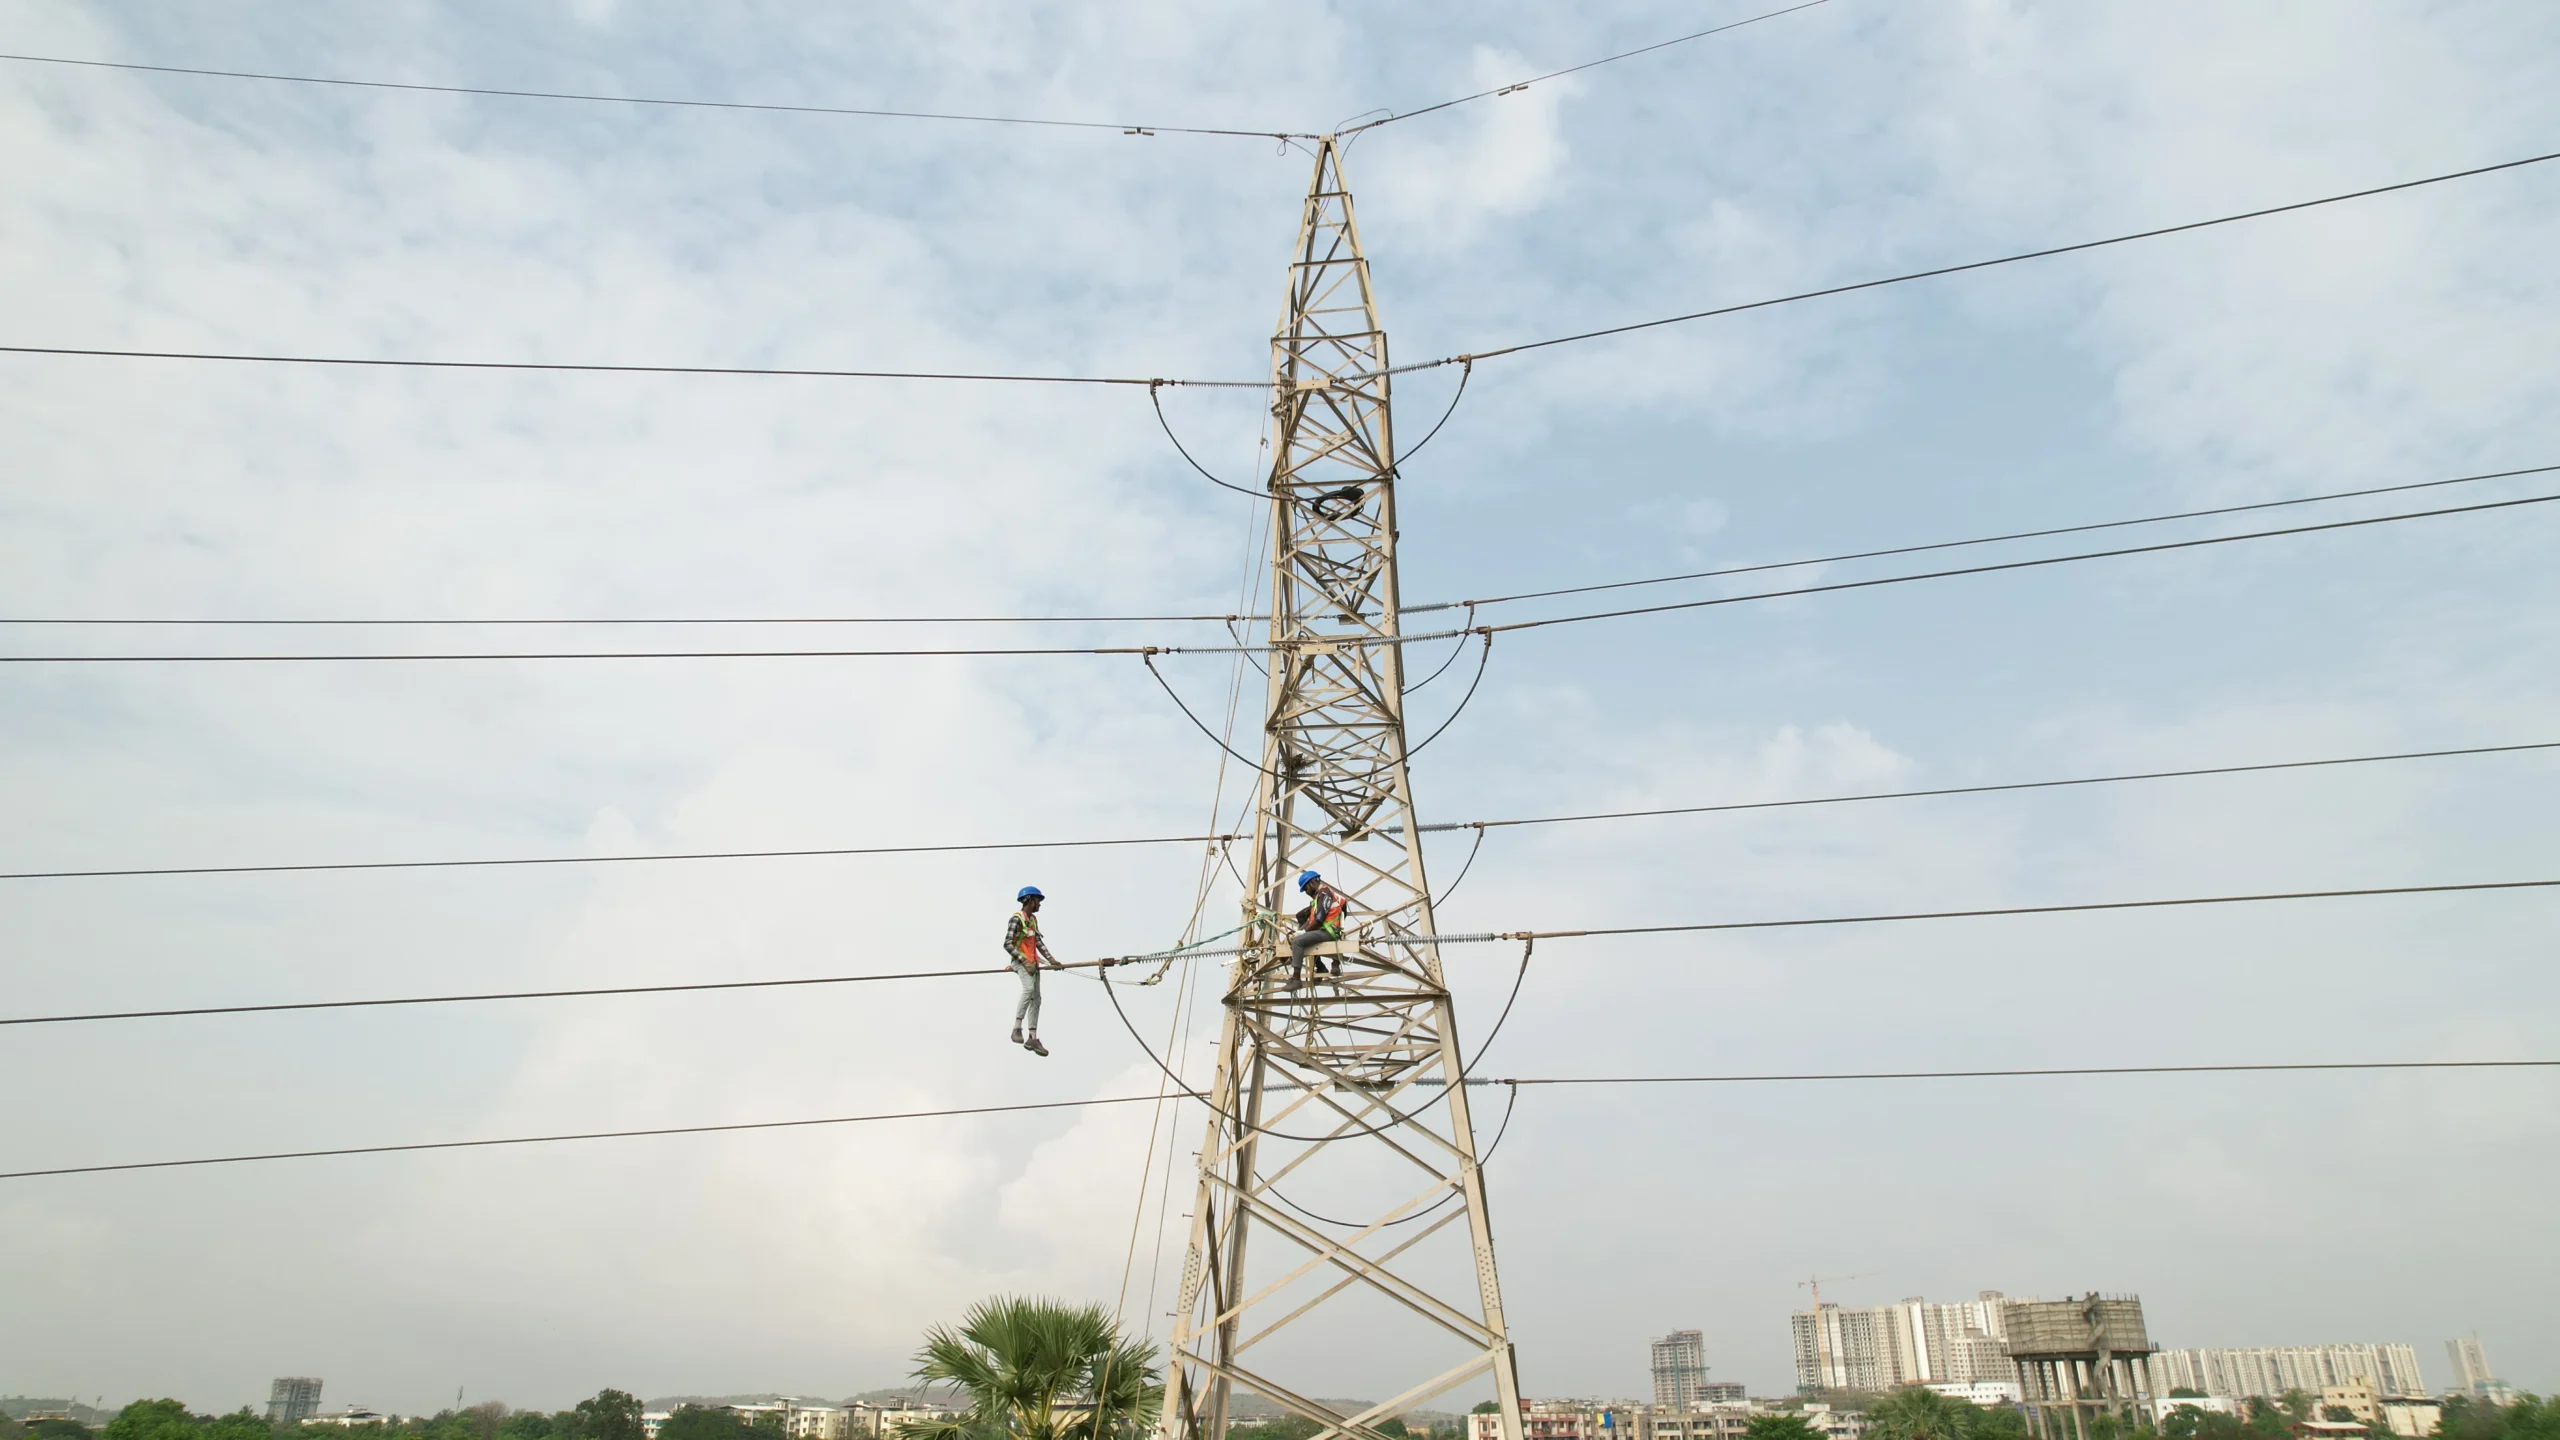
Substations and transmission
Smart meters
Grid sensors and IEDs

How the pipeline is built

Five layers, each with one job, so capacity and recovery can be tuned independently.

01

Distributed telemetry ingestion

Layer 1 of 5

A partitioned event-streaming platform receives telemetry from gateways, grid devices and upstream services. Settings are chosen to match the event schema and ordering requirements.

Partition keysBatchingCompressionBackpressure controls
Reference option
Apache Kafka or equivalent

Events spread across partitions so ingestion scales out.

02

Real-time stream processing

Layer 2 of 5

Horizontally scalable workers validate payloads, normalize event formats and enrich telemetry, then route events to operational consumers and analytical data stores.

ValidateNormalizeEnrichRoute
Reference options
Apache Flink or equivalentContainer orchestration

Stateless workers can be added per stage as load grows.

03

Resilient event processing

Layer 3 of 5

Durable retention, checkpointing where supported, retry policies, dead-letter handling and replay keep processing recoverable. Idempotent processing or deduplication covers duplicate delivery.

Durable retentionCheckpointingRetry policiesDead-letter handlingReplayDeduplication

Retained events make recovery a replay, not a data loss.

04

Multi-tier data storage

Layer 4 of 5

Each workload goes to a suitable layer: a short-retention operational store for recent readings, a time-series or analytical store for telemetry queries, and a durable data lake for historical analysis and model development.

Operational storeTime-series storeData lake
Reference options
Time-series databaseCloud object storage

Hot, warm and cold tiers keep queries fast and history affordable.

05

Monitoring and capacity management

Layer 5 of 5

The platform tracks ingestion throughput, processing lag, end-to-end latency, consumer health, error rates, storage growth and recovery time. Load testing and capacity planning set safe operating limits.

ThroughputProcessing lagEnd-to-end latencyConsumer healthError ratesRecovery time
Reference option
Centralized observability tools

Measured limits come from load tests, not assumptions.

Technology names are reference options. Not a claim that any technology was deployed for Tata Power.

One flow from meter to grid app

Six stages carry telemetry from the field to the people and systems that act on it.

  1. Stage 1

    Telemetry sources

    Smart meters, substations, grid sensors and intelligent electronic devices.

  2. Stage 2

    Edge gateways

    Collect device telemetry and forward it to the platform.

  3. Stage 3

    Distributed event ingestion

    A partitioned platform absorbs sustained traffic and bursts.

  4. Stage 4

    Stream processing

    Workers validate, normalize, enrich and route events.

  5. Stage 5

    Operational and analytical storage

    An operational store, a time-series store and a data lake.

  6. Stage 6

    Monitoring and grid applications

    Applications consume the data while monitoring watches the pipeline.

Validate before you commit

The architecture should be checked against the real workload, not assumed.

Event sizeSustained and peak trafficRetention policyOrdering guaranteesEnd-to-end latency objectivesRecovery requirements

Illustrative reference architecture. Not a measured deployment for Tata Power.

See the validation framework →

07 / Performance Validation

Performance Validation Framework

A reference telemetry platform should be evaluated against defined target conditions before production use. The framework below focuses on six core measurement areas, using illustrative target-metric visuals rather than reported results.

01 / Metric

Throughput

Evaluate sustained event ingestion and downstream handling capacity across realistic telemetry volumes.

Target metrics Capacity band
LowTargetHigh
02 / Metric

Latency

Assess end-to-end responsiveness for ingestion, stream processing and operational decision pathways.

Target metrics Response band
SlowTargetFast
03 / Metric

Data Integrity

Validate correctness across event ordering, duplication controls, delivery guarantees and stored telemetry quality.

Target metrics Quality band
WeakTargetStrong
04 / Metric

Resilience

Test recovery under node failures, network interruptions, replay scenarios and controlled degradation paths.

Target metrics Recovery band
FragileTargetRobust
05 / Metric

Scalability

Confirm the platform can expand horizontally while maintaining stable processing characteristics and delivery flow.

Target metrics Scale band
FixedTargetElastic
06 / Metric

Resource Efficiency

Review compute, memory, storage and streaming efficiency to support sustainable operating economics.

Target metrics Efficiency band
HeavyTargetLean

Recommended measurement framework only. Actual thresholds, benchmarks and operating targets should be defined against the deployment environment.

08 / Business Value

From grid signals to better decisions.

With dependable telemetry pipelines, utilities can gain the operational context needed to observe their networks, investigate events and plan for growth. These are potential benefits of the proposed architecture—not verified outcomes.

  1. Unified grid visibility

    Bring telemetry from smart meters, substations and connected devices into a more coherent operational view.

  2. Earlier anomaly awareness

    Enable timely investigation of unusual readings, event patterns and potential equipment issues.

  3. More actionable intelligence

    Translate high-volume grid events into useful operational insights and analysis workflows.

  4. More resilient data delivery

    Support traceable processing, recovery strategies and data continuity during component failures.

  5. Room to scale

    Accommodate expanding device fleets and new telemetry sources with horizontally scalable services.

  6. Better capacity planning

    Combine historical trends with live observations to inform resource use and infrastructure decisions.

Potential business value only. Actual outcomes depend on the deployment environment, implementation evidence and operational validation.